5 eye-popping stats from the 2024-25 season

Breaking down the historical impact of the 2024-25 season from the Thunder, Cavs, Celtics and more.
There are just four days left in the 2024-25 season, a historical year in many ways.
Here are some numbers that stand out from the last six months …
1. The Thunder are the best ever
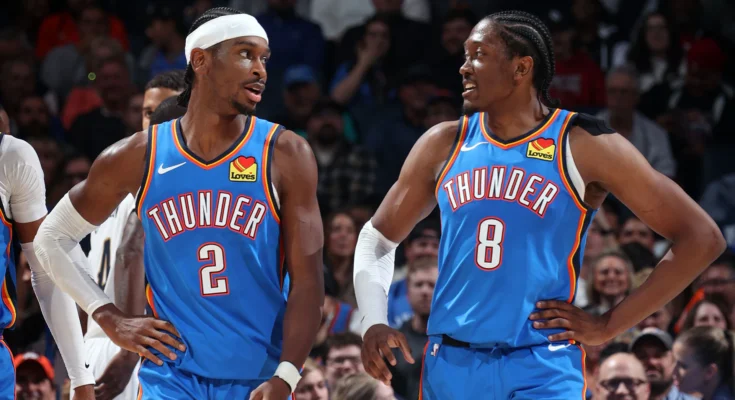
The Thunder, statistically, have been the best team in NBA history. They’ve outscored their opponents by 12.6 points per game, the best differential for any team in this league’s 79 seasons.
Best point differential, NBA history
| Team | Season | W | L | PCT | Pt. diff. |
|---|---|---|---|---|---|
| Oklahoma City | 2024-25 | 66 | 14 | .825 | +12.6 |
| L.A. Lakers | 1971-72 | 69 | 13 | .841 | +12.3 |
| Milwaukee | 1970-71 | 66 | 16 | .805 | +12.3 |
| Chicago | 1995-96 | 72 | 10 | .878 | +12.2 |
| Golden State | 2016-17 | 67 | 15 | .817 | +11.6 |
The Thunder have outscored their opponents by 1,006 points in their 80 games, while the 1971-72 Lakers were a plus-1,007 in 82. So, to finish (outright) with the best point differential in NBA history, the Thunder need to have a total differential of plus-2 over their last two games (at Utah, at New Orleans).
The Thunder’s 38 wins by 15 points or more are the most in NBA history, topping the previous record (37) held by the 1970-71 Milwaukee Bucks. They have just two losses by 15 points or more.
A few more notes about the Thunder’s dominance …
- They’ve committed 5.3 fewer turnovers per game than their opponents, which would be the best turnover differential in the last 37 years.
- They’re 18-10 (.643) in games they trailed by 10 points or more. That would be the best record when trailing by double-digits for any team in the 29 seasons with play-by-play data. No other team this season is better than .500 (Cleveland is next at 13-14) in games they trailed by at least 10 points.
- They finished with the best interconference record in NBA history, going 29-1 against the East.
2. Three seasons of two-way success in Boston
For the second straight season, the Thunder are one of two teams that rank in the top five in both offensive and defensive efficiency. The other is the Boston Celtics.
If they stay there (they’re currently fifth on defense), this will be the third straight season in which the Celtics ranked in the top five on both ends of the floor. They would also be the first team in the 48 years that turnovers have been counted to accomplish that feat.
There were only 22 teams in the late 1970s, so it would have been easier to finish in the top five on both ends. The Celtics are set to do it in a 30-team league … in three straight seasons. That’s a remarkable run of two-way success.

Top 5 on both ends of the floor in two straight seasons, since 1977-78
| Team | Season 1 | Ranks | Season 2 | Ranks | Titles |
|---|---|---|---|---|---|
| Boston | 1979-80 | 2, 4 | 1980-81 | 5, 4 | 1 |
| Boston | 1984-85 | 2, 4 | 1985-86 | 3, 2 | 1 |
| Seattle | 1992-93 | 5, 3 | 1993-94 | 2, 4 | 0 |
| Chicago | 1995-96 | 1, 1 | 1996-97 | 1, 4 | 2 |
| Toronto | 2017-18 | 2, 5 | 2018-19 | 5, 5 | 0 |
| Boston | 2022-23 | 2, 2 | 2023-24 | 1, 2 | 1 |
Ranks = Ranks in points scored and points allowed per 100 possessions
Titles = Championships won in that two-year span
Note: Possessions are estimated through 1995-96, actual since ’96-97
The Thunder are positioned to join this list, while the Celtics can create a new list of their own.
3. More and more 3s
The Celtics’ offensive success is built on the highest 3-point rate for any team in the 46 seasons of the 3-point line. They’ve taken 53.6% of their shots from beyond the arc, a rate that’s 1.14 times greater than any other team.
But while the Celtics have the highest 3-point rate by a huge margin, they’re not alone in seeing a jump from last season. Twenty-four of the league’s 30 teams have taken a higher percentage of their shots from 3-point range this season than in 2023-24.
There was an 11-year stretch where the league-wide 3-point rate went up every season, from 22.2% in 2010-11 to an all-time high of 39.9% in 2021-22. Then it saw a drop (to 38.7%) two seasons ago, before jumping back up to 39.5% (the second highest rate ever) last season.
This season, the league has taken 42.1% of its shots from 3-point range, by far the highest rate in the 46 years of the 3-point line. Last season’s rate was the highest ever, and this has been the second biggest season-to-season jump in the last 30 years (since the 3-point distance was shortened in 1994-95).
The rise in 3-point rate continues to come at the expense of mid-range shots, which account for less than 10% of all field goal attempts for the first time. The percentage of total field goal attempts that have come in the paint has been over 57% in each of the last three seasons, having never been at that mark in the previous 26 years of shot-location data.
Percentage of shots coming from paint, mid-range & 3-point range, last 5 seasons
| Season | % Paint | % Mid-range | % 3-point |
|---|---|---|---|
| 2020-21 | 56.1% | 12.9% | 39.2% |
| 2021-22 | 56.6% | 12.8% | 39.9% |
| 2022-23 | 57.8% | 11.8% | 38.7% |
| 2023-24 | 57.4% | 11.2% | 39.5% |
| 2024-25 | 57.1% | 9.8% | 42.1% |
Through Wednesday, 14 teams have attempted fewer mid-range shots than DeMar DeRozan (623).
The huge leap in 3-point attempts hasn’t had a positive effect on overall efficiency, in part because 3-point percentage is down with the higher volume. The league has scored 113.7 points per 100 possessions this season, the third-highest mark ever, but down from last season (114.5) and the season prior (114.1).
4. The Cavs are the most effective shooting team ever
The Cleveland Cavaliers are the only team that ranks in the top five in both 3-point rate (45.8%, fourth) and 3-point percentage (38.4%, first).
Both marks are lower than those of last season’s Celtics, but the Cavs also lead the league in field goal percentage in the paint. Their 61.2% shooting in the paint is the seventh-best mark for any team in the 29 seasons of shot-location data.
With great shooting inside and out, the Cavs have an effective field goal percentage of 58.1%, which would be the best mark in NBA history, topping that of last season’s Indiana Pacers (57.8%).
Through Wednesday, there are 16 players with an effective field goal percentage of 60% or better on at least 500 field goal attempts, and the Cavs are the only team with three of the 16: Jarrett Allen (71.1%, first), Evan Mobley (60.7%, 13th) and Ty Jerome (60.4%, 14th).
The Cavs also rank in the top five in turnover rate, and having scored 7.8 more points per 100 possessions than the league average, they have what would be the fourth-best offense in the 29 seasons of play-by-play data.

5. Daniels, Wembanyama record big defensive numbers
There’s still some work being done defensively, and two players have put up historical numbers on the other end of the floor.
The Hawks’ Dyson Daniels has averaged 3.0 steals per game, 1.2 more than any other player. He’s in a position to be the first qualified player to average at least three steals per game in the last 31 seasons (since Nate McMillan in 1993-94).
Beyond that, Daniels has averaged 5.8 deflections per game, 1.6 more than any player has averaged in the nine seasons for which we have “hustle” stats. His 433 total deflections are 169 more than any other player has.
Victor Wembanyama, unfortunately, had his season cut short at the All-Star break, so he doesn’t qualify for the league’s block leaders. He still has 32 more blocked shots than anybody else in the league, and his 3.8 blocks per game this season were the most for any player in the last 26 years.
Wembanyama also blocked all those shots while avoiding foul trouble. He had a rate of 1.68 blocks per personal foul, topping his own mark for the highest for any player in the 52 seasons that blocks have been tracked.
Highest ratio, blocks per personal foul, since 1973-74
| Player | Season | BLK | PF | BLK/PF |
|---|---|---|---|---|
| Victor Wembanyama | 2024-2025 | 176 | 105 | 1.68 |
| Victor Wembanyama | 2023-2024 | 254 | 153 | 1.66 |
| Manute Bol | 1986-1987 | 302 | 189 | 1.60 |
| Tim Duncan | 2012-2013 | 183 | 117 | 1.56 |
| Ben Wallace | 2001-2002 | 278 | 178 | 1.56 |
Minimum 100 total blocks
* * *
John Schuhmann is a senior stats analyst for NBA.com. You can e-mail him here, find his archive here and follow him on X.
The views on this page do not necessarily reflect the views of the NBA, its clubs or Warner Bros. Discovery.


